A Forex View From Afar

A Trader's Look At A Trader's Life

Forex Analysis

What’s next for the Cad

Written by A Forex View From Afar on Saturday, May 31, 2008

Back to www.thelfb.com

GDP numbers this week revealed that the Canadian economy shrank for the first time since 2003. The release for the first quarter of 2008 revels a 0.1% contraction, falling from the 1% growth rate recorder in Q1 and Q2 2007.

The biggest drag for the economy was inventories, which weighed heavily on the GDP, by over 1%. Exports fell too, dragging down the GDP by over 0.3%. The big decline in both exports and inventories were blamed on the automotive industry, falling almost 15% from one quarter earlier.

Canada’s biggest trading partner is the US, both for the import and export industry, with the U.S. eating up almost 80% of Canada’s exports 2006 figures show, while 55% of Canada’s import are from US. It is quite interesting that imports to Canada had fallen in the first quarter, despite Canada having very strong growth in the private consumption sector.

The big drop in Canadian Inventories makes me think about the US Inventories adding a lot of points to the US GDP. If we took out Inventories from the US numbers, in the last two quarters, Q4 of 2007 and Q1 of 2008, the GDP would have come in negative. This however was the case it seems. The question is how come those inventories didn’t fall since U.S. production had weakened, as shown by the ISM number, Exports had increased and US consumption remained strong, but still Inventories didn’t reduce. That is very strange, something just does not add up there.

This certainly isn’t the case for the Canada, if we took out Inventories, the report would show an expanding GDP.

Another big concern for the Canadian economy can be the huge inflation rate that manufacturers have to absorb from raw materials. From March 2008 to April 2008 the inflation experienced by manufactures from raw materials was released at 5.1%, while from April 2007 prices had grown 23%. Huge by all means. At the same time, Canadian Factories increased prices by 1%, from last year. These numbers suggest factories are absorbing a huge amount of inflation, something really not welcome on their balance sheets, and something that needs decreasing inventories and increasing exports to help relieve.

In the mean time the Canadian Dollar tries to push lower, but doesn’t have strength to do so. The one Dollar mark and the 0.9750 area don’t look as they could give up too soon, either way, so another range/consolidation period could come very easily.

The new Bank of Canada Governor, Mr. Mark Carney, suggested rates will be hiked when GDP numbers assure a sufficient growth rate; well, probably not too soon then, and as such we will not expect too much from the Cad, either way.

Mr. Mishkin departs from the Fed

Written by A Forex View From Afar on Thursday, May 29, 2008

Back to www.thelfb.com

Mr. Mishkin has announced his intention to leave from the Fed, to return to his academic research. Mr. Mishkin resignation will create the third empty seat on the Fed’s voting committee, out of the 7 seats available.

This will certainly be a first for the Fed, having to work with 4 Voting Members only. The majority has to agree over an interest rate decision in order for it to pass.

Mr. Mishkin is well known in the academic environment for his Economic Research, being of one the most prolific researchers in his field. A list of his works can be seen here.
Both the WSJ and Bloomberg said his departure was influenced by the big distance from his wife (200 miles, from New York to Washington DC) saying Mr. Mishkin will make a twice as much working at the Columbia University, were he will return.

WSJ point out some of his incomes before coming to the Fed:


His financial disclosure report, released in 2007, shows that in the year before joining the Fed in 2006, he made a tidy sum dispensing advice to central banks, governments and business groups around the world. He collected a $134,858 consulting fee from the Icelandic Chamber of Commerce; $63,188 from the Riksdagen, or Swedish Parliament, who hired him to co-write a report on the Swedish central bank; $15,600 from the Central Bank of Chile, $15,575 from the Bank of Korea, $9,161 from the Bank of Spain and $4,250 from the Bank of Canada. That was all in addition to his salary from Columbia University.


I can’t tell the exact reasons why Mr. Mishkin has left the Fed mandate, but what I can point out, and for me it’s very funny, is both Mr. Mishkin and Mr. Bernanke are supporters of the Inflation Targeting system, something that is not spoken of at the Fed; they wrote a very well known research paper about it.

Source:
WSJ: Mishkin Resigns: A Look Back

The Big Guys are talking

Written by A Forex View From Afar on Wednesday, May 28, 2008

Back to www.thelfb.com

The financial markets have a unique characteristic, when the Big Guys say something about prices, the markets react in the short-term; when they predict an event (e.g. Inflation) they usually fail. Sometimes, with between 200-300 predictions, they get one right, and the whole word finds out about it, glorifying them.

Well, the Big Guys have spoken; let us do a little analysis.
Morgan Stanley said Oil prices could easily reach $150 per barrel, and soon Oil recovered every single penny that was lost in previous trade. From my weak memory, didn’t someone say last week Oil will reach the $200 barrier, to start the upward move? Quite interesting that Morgan Stanley said this when the Oil Market had plunged. Are they long on Oil?

Michael Feroli an economist at J.P. Morgan Chase predicted Inflation will reach 5.1% in August. I really don’t doubt inflation will rise in the short to medium term, but I don’t expect to see it in the CPI read, by no means. Probably they are shorting the Bonds and Treasuries right now

UBS had told former private-banking employees not to travel to US, due to charges of evading taxes. Furthermore, UBS had hired lawyers for more then 50 current and former employees. I don’t know what this Bank does except of write-down after the sub-prime fiasco. I can’t tell what positions they have, but I bet the US Attorney is short on UBS.

Sources:
Bloomberg: Oil Rises After Morgan Stanley Says Brent Oil May Reach $150
FT: UBS tells unit staff to avoid US visits
WSJ: J.P. Morgan: Inflation to Hit 5%

Case-Shiller: That Housing bottom is not here

Written by A Forex View From Afar on Tuesday, May 27, 2008

Back to www.thelfb.com

Another release for the housing market, the S&P/Case-Shiller Home Price Indices have recorded the biggest decline since the Index was started 20 years ago. Housing prices had declined further, now reaching a 14.1% decline since last year, without having a bottom in the sight.

Out of 20 metropolitan areas, 19 show declines, Charlotte being the only one with a modest 0.8% gain since last year. In 6 areas prices have fallen more then 20% since last year.

Case-Schiller Housing Market Price Index

If we add that Housing Inventories, released last week, reached yet another record of 11.3 months, we could say the Bottom in the Housing Market isn’t anywhere in sight, although it could give a huge push forward to the economy, and especially for the Dollar, once the bottom is set and the recovery phase begins.

Another big winner in the housing market recovery will be consumers; it will noticeably increase their confidence due to the housing-welfare relationship. By the way, Consumer Confidence had dropped to the lowest read in 16 years, in-line with housing stats, maybe they will reverse just as quickly once mortgages are available and the economy shows growth.

If we could only kick-start the Housing Market things might get start rolling, but until they do just watch for the Dollar to start prodding some Resistance areas as Trade Desks test out where the heavy Ticket Orders are sitting. Upside Dollar moves may come in the near-term as the natural reaction to an over-sold $ plays out- but take care because the intra-day reversals from those moves that do hit the areas of heavy Ticket Orders will send things packing backfrom where they just came.

9 months Housing Inventories will be a light at the end of the tunnel, and at that time we can maybe plot how the greenback is going to get back the last 9 months of stolen ground, and against which pairs first.

The Housing slump

Written by A Forex View From Afar on Friday, May 23, 2008

Back to www.thelfb.com

Another U.S. housing release, another failed hope that something could improve. Existing home sales showed that the housing slump is far from at a bottom, although the release number came in better than analyst predictions.

Housing inventories have reached a record 11.2 months, and there are now 4.5 million houses for sale, that is up one 33% since last year, while prices have fallen even further, now a long way from the 2005-2006 tops.

We could say 'nothing is new' in the housing market, that it is hard to see anybody waiting for a rebound in home sales at this point in time.

If we add that 3 million homes are said to join the Inventory over the next two years through foreclosure, the Housing Market recovery looks far off. Not to mention that many expect prices to drop even further from current levels, and that will increase Inventory as optimistic home-owners wait for what they see as Fair Value. Right now, any offer may be the best offer most will see for a while.

By now the drill should be known- no Dollar recovery until the housing market starts reducing the Inventory numbers, and until they reach somewhere around 6 months, as was the norm.

It will be interesting to see how consumers react in this period of contraction, since housing wealth was said to be the reason behind increased consumer spending, and also how the negative $63B U.S. Current Account reacts in response. The $600 Stimulus Checks are arriving this week, at a huge expense to the government checking account.

The weaker US$ could be a good opportunity for US exporters to reduce the Trade Balance, and that may be key to sustaining longer-term growth going into 2009/10.

Oil at $135. What analyst have to say about it.

Written by A Forex View From Afar on Friday, May 23, 2008

Bloomberg had an interview with a range of analysts, from the well known trader George Soros to the Head of the International Energy Agency, Mr. Tanaka about the future of Oil.
Most of the analysts view the market as illogical, and many didn’t exclude Oi's future appreciation;

Link Here

The Sub-Prime Bug

Written by A Forex View From Afar on Wednesday, May 21, 2008

Back to www.thelfb.com

One of the biggest miracles, and unanswered questions, of the last Quarter was how some complex derivate debts could receive Triple A rating, when they worth no more than a few cents per dollar

It seems that a partial answer has been revealed this week; a bug in Moody’s rating software made possible the misleading rating of debt products, from speculative grade to investments grade. It seems the error was discovered somewhere at the begging of 2007, but kept away in a hidden file.

The ratings were later corrected, but only half a year later. It’s quite interesting that the complex debt could carry such a high rating for such a long period of time, and nobody lifted any eyebrow, or could be bothered to lift their head from the trough that was being gorged on. It begs a question; since the initial discovery of the rating-failure why did so much time pass before measures were taken?

More interesting is that the complex debt security, named CPDO, needed 2 rating company's approval in order to be quoted. The other AAA ratings were awarded by the S&P, which even now stands by their decision when that paper is worth anything at all.

As a note the U.S. T-Bills and Bonds have AAA rating, and there are a lot of Countries that don’t have such a rating, American debt is first class, so the rating agency says. Further reading about the CPDO can be done here

This is a week full of surprises. After finding out exactly how the U.S. CPI is calculated, now we find out how the ratings business works. All that is left to find out this week is the Fed’s M3, or amount of money in circulation, and we will have a high-quality week. Mind you, that will never happen, there is no way that Fed will spill the beans on that, most would be horrified at what is beinb printed compared to the debt, and compared to the Reserves.

"The cost of producing Money Supply data is prohibitive"- The U.S. Federal Reserve.

"Wise Men learn more from Fools than Fools can ever learn from Wise Men"- TheLFB.

Source:
FT Alphaville exclusive: Moody’s error gave top ratings to debt products

How the CPI and PPI is calculated…

Written by A Forex View From Afar on Tuesday, May 20, 2008

Back to www.thelfb.com


Germany, a country obsessed with inflation- PPI 1.1%
Switzerland, a country known for its price and financial stability- PPI 0.4%
UK PPI a month over month read - 2.4%
US PPI merely 0.2% (No typo, it is at 0.2%)

Doesn’t all that seems odd, most countries show inflation and a lot more are experiencing it, but US simply doesn’t want to show any at all? Even Japan has inflation, a country that has experienced deflation for years.

Well, it seems someone had finally come up with the reason why US does not experience inflation issues in their statistics, but does experience huge inflation in Consumer's pockets.

John Kemp at Sempra Metals had found out that BLS, the government agency that deals with Labor Statistics, likes to flatten-out prices as much as possible. The chart underneath speaks all by itself.

Gas Prices, How the CPI and PPI is calculated

Gasoline prices have gone up by 10% since January 2008, while the BLS calculated prices had actually decreased by 3%, over the same period of time.This can be explained by the fact stat agencies release their data in adjusted format, to avoid sudden movements in prices and volatility. we then do not know how truthful the adjusted data the is, since they record a price we feel in our pockets 6 months later, or even further out

The adjusted data has also another major draw-back- over time this rather huge price increase will be absorbed into the CPI and PPI, so if inflation persists over the medium term, we are going to see some inflationary reads coming out of US.


Gasoline prices account for around 5.5% of the total CPI. If they increase around +15.5% by the end of the year (on an adjusted basis) that will add +0.85 percentage points to the headline inflation rate taking it from +3.9% in the twelve months to Apr to as much as +4.8% in the twelve months to Dec (other things being equal).
John Kemp, Sempra Metals


With Oil reaching $129 per barrel, it seems by the year-end that inflation will be higher than it reads now, unless of course someone doesn’t decide to change, again, the way that Inflation is calculated.

This study was the case for Oil, just think how much most commodities and services have increased their prices lately. Where will the CPI be at the end of the year, then? By all accounts way under what the US Consumer feels each day, and therefore way under the reads that are used in other regions to value their currency against the Usd.


Source:
FT: Real, on-the-road, US inflation

Oil at 127$

Written by A Forex View From Afar on Tuesday, May 20, 2008

Oil at 127$

Three Bubbles in 8 years leads to a new approach?

Written by A Forex View From Afar on Saturday, May 17, 2008

Back to www.thelfb.com

2 bubbles have burst in less than a decade- the 2000 Tech Bubble and 2007 Housing Bubble, now the 3rd one is forming: the commodity bubble

Commoditie Index Bubbles

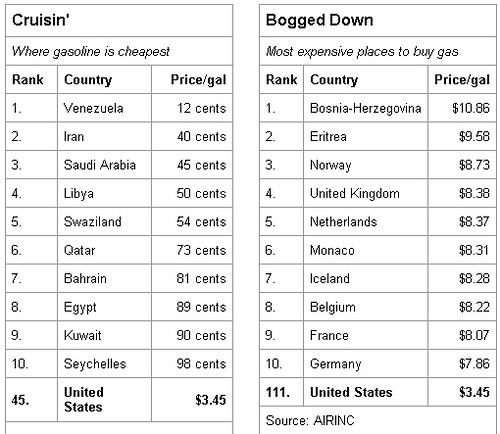
Since September 2007 global Commodities Indexes have gained between 40% and 70%, putting additional pressure on consumers who are suffering higher prices. Some will argue the supply/demand relationship triggered this rise, saying there is no bubble because inventories have not increased- pure supply and demand drivers. While others will argue that commodity price gains are a consequence of the loose monetary policy of the previous year. The Indian and Chinese stockpiling of energy is something to bear in mind, because the average price that they will have on a barrel of Oil may seem very expensive if we see a pull-back. That could add to the reversal momentum when it does come.

The important part is that Oil prices are affecting our limited consumer pockets, and something may have to be changed in Fed’s mentality of ignoring inflation and concentrating on growth. A low value Dollar may be what is required to create a Jump-Start, but by doing so it is allowing a Bull run in Oil to turn into a stampede. By every possible standard, two bubbles and 8 years is huge, not to speak about the newly forming one- Commodities.

Last week gave the perfect opportunity for Fed official to make a public move that could have helped the consumer, and their battle with Gas and energy prices. First, as some part of the media covered, was the change of attitude over Bubbles.
The Fed’s view was that they can’t stop bubbles from forming because they are too hard to be spotted in real-time, and even if they are spotted, by every means it should avoid monetary policy to stop them.

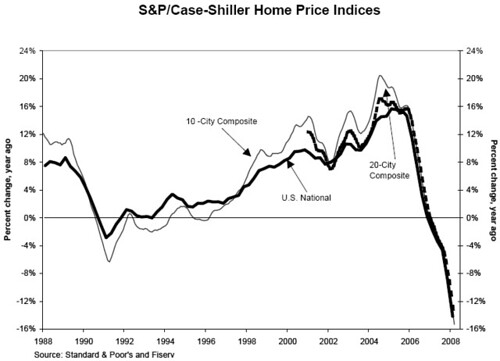
WSJ journal provides a chart of the recent bubbles. A 5th grader could see something wrong in those chars, especially in the Las Vegas prices, were prices increased exponentially, forming an almost vertical line.


Tech, Housing and Commodity Bubbles

Going further with the Fed’s view- monetary policy shouldn’t be used to stop the bubble, but it should be use to heal the economy once the bubble burst. Unfortunately, until now, they have only managed to create another bubble.

Usually, bubbles are created by inaccurate monetary and fiscal policies. To correct a fiscal policy is an almost impossible job, it takes months (if not years) for a law to be passed and a lot of time until is implemented. A monetary policy however needs no more than a few hours to impact, the market effect is almost instantaneous.

Higher interest rates, to stop a forming bubble, will mean the economy will slow, maybe the unemployment number will rise too, which is against Fed’s policy, so intervening while a bubble is forming seems very unlikely. This is why virtually all major Central Banks have one role: fight inflation. That is except the Fed.

In last week’s Fed Speeches some members started to discuss their rethinking on this policy, non-intervention while Bubbles are forming. It is a welcome step forward for the Fed, which we should be pretty proud off. You know, you first have to admit to have a problem, in order to solve it

"Hello everybody. My name is Fed, and I'm a bubble-holic".


The other big shift in policy that was seen last week in the Fed’s speeches was Mr. Bernanke trying to urge Congress to pay Interest on reserves sooner than 2011, when the Fed would normally start too. Always bear in mind that the Fed is not a Central bank, it is a private company that holds the Government check book, and therefore holds the taxpayers money, (for safe keeping of course). But unlike any other major region, the Federal Reserve is a private business that charges the Government for the task of holding, printing and counting (oh no, forget counting, the Fed scrapped Money supply numbers- "too costly to produce". Obviously cut into the private business profit line) the taxpayer's money.

Banks are required to keep a percent of their deposits in the Fed safe-fault, on which the Fed does not pay Interest, although other Central Banks do. Over time, paying Interest was proven to be very effective. Some academic papers suggested that the big difference on how the Fed and ECB handled the sub-prime lay in other bank’s reserves at their Central Banks. At the time when the Sub-Prime crisis began European Banks had 10 times more reserves at the ECB then US Banks at the Fed, and only because the ECB pays interest on those deposits, and encourages banks to save.

Sound familiar? The US income to expenditure rate is negative, the US, and the Fed, does not encourage saving- who needs it when a line of credit is always available? Or not, maybe. Lesson learned, rainy day savings are not just 401k's and Roth IRA's, the Stock market is for investment and asset appreciation over time, savings accounts and low credit card bills are what the Fed could teach by paying interest and setting rates that will tackle the overdrawn Government checking account. Lead by example maybe, rather than leading by looking for profit first. But as a private business the profit line maybe comes before the winning line, who knows? back to the point at hand..

Paying no interest, as is the Fed policy, makes banks hold no more than are legally required, with any and all cash surplus then lent to other banks, usually underneath the Fed Funds rate (Discount Window), which puts additional and unwanted pressure on the system. This pressure can be very bad, especially when the Central Bank, in our case the Fed, is in rate hike cycle. Banks borrowing under the Fed Funds sends rate down, while the Fed needs them up to be able to fight inflation.

Roll on paying Fed Interest, it may lead to a system in place and a thought process that comes from it to know that we need a savings umbrella to weather the stormy times. We can all learn from the Fed's lesson, and hopefully sooner rather than later.


Source:
WSJ: Fed and Bubbles: First, Heal Thyself?

Fed Funds Future

Written by A Forex View From Afar on Friday, May 16, 2008

Fed Funds Future

Fed Funds Traders are pricing in a hold decision from the Fed, for the next meeting in June. The recent released data, points out inflation had moderated, while the unemployment number remained fairly constant.
If we add the 600$ Rebate Checks to the above fantasy data, the Fed doesn’t have too many reasons to cut.

That Dollar Libor again

Written by A Forex View From Afar on Thursday, May 15, 2008

Back to www.thelfb.com

There is no problem with US Banks and liquidity it seems; the inter-banking loans go very well, it is just that the Libor (London Iter Bank Offered Rates) rates do not reflect it. The Banks have all the required capital they need, they may sell a 5bn stake from time to time from the assets, but that is only for publicity reasons and to appease the Fed Chairman in his repeated calls to capitalize.

One month ago the Dollar Libor had a sudden increase, after rumors about banks not telling the truth about their loan rates to one another and that the British Bankers Association (BBA) investigating the rates bank reported. Further reading can be found here

Surprisingly the Banks blamed it on the Londoners. BBA was the guilty party because US Banks reported abnormal, very low quotes.

Now, the Dollar Libor is rising again, because the BBA wants to change the way things work. On May 30, a report will be submitted to an advisory commission discussing the need of changing the way that Dollar Libor is calculated, to reflect the real conditions of US Money Markets.

Financial Times highlights the possible new ways to gauge the Libor rate;


One possible change would be to ask banks what rate other banks are borrowing at. Other possible reforms including changing the time at which the BBA calculates dollar Libor, to ensure that this is set when American markets are open, or expanding the number of US banks that submit quotes.


Really? this is it? ”ask banks what rate other banks are borrowing”. This seems quite strange. If banks do not trust each other now, to lend money between them, how could someone ask a bank about another bank? If someone wants to send rumors out then it will just report wrong rates for that bank.

The first Bankruptcies will be just around the corner with this method.

A new method is certainly needed for the Libor, but a serious one, which requires the banks response and interaction too.

Source
FT: Speculation grows over Libor changes

The US CPI and the rest of the World

Written by A Forex View From Afar on Wednesday, May 14, 2008

Back to www.thelfb.com

The global CPI/Inflation situation looks like this now:

• The Bank of England inflation runs at 3.0%, requiring the Bank’s Governor to send explanation letters to Parliament. This is telling traders that inflation will not be coming down too soon, and there are not too many chances of a rate cut.

• The Bank of Japan just announced the biggest inflation increase in the last decade, they are also jawboning about the possibility of a rate increase. A rate increase, for Japan? That is something pretty new, after the “quantitative easing” strategy.

• The Bank of Canada announced that inflation will reach the upper limit of it’s target, and that when GDP growth hits 1.5% they will look to raise rates.

• The Reserve Bank of Australia already has a high interest rate, 7.25%, whilst the CPI is running at 4.2%, year-over-year, two big numbers.

• The ECB seems a little obsessed with inflation, and now some political leaders are starting to follow that mantra. Clarity in the fact that growth comes second at the ECB with their single mandate- price stability.

Now, bear in mind that all commodity prices are way up, including food and energy. Agreed? OK, now you can read the next one;

• The US CPI shows no signs of inflation. (That is not a typo, the US CPI really does not show any signs of inflation)

If you know where to look, and it is not easy to find, you can find the scoundrel Inflation hiding in the print, but in order in order to see it you really have to monitor the components that make up the US read;

• Food had recorded a monthly gain of 0.9%, the biggest gain in 18 years

• Energy stayed flat. (Hmmmmmm, come on Pinocchio, your nose will get bigger). A look at the nearest Gas station proves that wrong, not to say a look at any Oil Chart. It was only last week that Equities were trembling because Oil was breaking new highs at $125.

• A big drop in the recreation, and lodging area, 0.1% and 1.9% respectively. It appears that not too many Americans will be making any trips too soon

• Seasonally adjusted, Transportation fell too, by 0.7%, while Gasoline is down 2% (no typo here either, Gasoline is lower).

Where do they get these numbers, and why does nobody question them? Do you know where the real inflation numbers will be felt? In the value of the Dollar in your pocket as Inflation breeds and infects all aspects of the economy, thriving in the low interest environment.

The Fed has a tough job here, raging Inflation that can't be seen, and an economy that needs to quickly find its feet, but shows little signs of sustainable growth until at least Q1 (1st quarter) 2009. Until then the Usd valuations are probably not going to allow too much appreciation, and at best may send most major pairs into a sideways channel through the summer. We may have to get used to trading the 200-300 pip ranges for a while.

The UK housing market

Written by A Forex View From Afar on Tuesday, May 13, 2008

Back to www.thelfb.com

If bad news about the US housing market is not something new, and US equities appear to be “bulletproof” from the consequences of more bad news, for some the bad news regarding UK’s Real Estate sector is fresh news.

US Single Family home prices have dropped the most since 1982, the National Association of Realtors reveled today; it would have beaten the 1982 numbers too, but there is not any data beyond that year.

On the other side of the Pond UK Real Estate is in better shape them the US, it seems. Year over Year, the prices are still positive, which the US cannot say.

From last year prices across the UK had climb 5.2%, down from 11% in July 2007, but for the City of London, known for its dynamic market, prices have gain only 7% from last year, after recording a 20% gain last summer .

UK Housing Market

It is pretty obvious things could have been worse, but UK home prices have had important declines. The worse part is in the RICS Housing Market Survey, it revealed that a staggering 95% of respondents have reported a drop in prices, for the ninth consecutive month, and the first month when all areas reported price declines.

Even if demand is weak, due to tight credit conditions, the same survey reveals that the housing supply is quite limited, making the downturn look better then past demand slumps. Usually a small supply is a big advantage when dealing with a slowdown in the housing sector, making things easy when buyers eventually appear into the market.

Unfortunately the Bank of England cannot cut as much as the Fed did- the newly releases CPI numbers stand at 3.0%, and therefore will not allow the Central Bank to loosen their monetary policy. With the new highs made last week in Oil prices, the CPI has some more room to run to the upside.

Need a wheelbarrow to carry some money…Anyone got one?

Written by A Forex View From Afar on Friday, May 09, 2008

Back to www.thelfb.com

This could be very easily taken as an advertisement; I want to help some friends move a big pile of cash, about $400bn of it. So I need a big wheelbarrow, after forgetting the idea of moving the pile with a truck because of Oil just hitting $126 a barrel we can’t afford the Gas bill, it will cut into the stash too much.

My friend’s name is Citigroup, and they want to sell everything they have got, in order “to reduce cost and assure growth”. In reality, they just want cash to cover all the sub-prime mess that they gorged on last year.

But I’m really curios; Citi lost $5 billion in Q1, having more then $40 billion in credit related write-downs, why do they actually need so much money? Are they preparing a surprise announcement sometime in the next quarter?

I wonder how all those zeros, 11 of them, will fit in my small wheelbarrow, and I wonder why Citi really needs the cash.

wheelbarrow to carry Citi's money

ECB Press Conference Bullet Points

Written by A Forex View From Afar on Thursday, May 08, 2008

Looking for an ECB rate cut?
Back to www.thelfb.com

• Inflation rates have risen significantly since the autumn
• inflation rates are expected to remain high for a rather protracted period of time, before gradually declining again
• upside risks to price stability prevail over the medium term
• economic fundamentals of the Euro-zone area are sound
• macroeconomic data continue to point to moderate but ongoing real GDP growth
• uncertainty resulting from the turmoil in financial markets remains unusually high and tensions still persist
• we emphasize that maintaining price stability in the medium term is our primary objective
• anchoring of medium to longer-term inflation expectations is of the highest priority
• current monetary policy stance will contribute to achieving our objective
• industrial production showed resilience
• economic sentiment generally continued to soften
• Euro-zone area economy has sound fundamentals and does not suffer from major imbalances
• domestic and foreign demand are expected to support ongoing real GDP growth
• growth in the world economy is expected to remain resilient, benefiting from strong growth in emerging economies
• strong growth in emerging economies should support euro area external demand
• employment and labor force participation have increased significantly and unemployment rates have fallen to levels not seen for 25 years
• The uncertainty surrounding the outlook for economic growth remains high
• Risk relate to the potential for the financial market turbulence to have a more negative impact on the real economy than previously anticipated.
• downside risks stem from the dampening impact on consumption and investment of further unanticipated increases in energy and food prices
• inflation from sharp increases in energy and food prices
• HICP inflation rate is likely to remain significantly above 2% in the coming months, moderating only gradually over the course of 2008
• protracted period of high annual rates of inflation
• risks to the outlook for inflation over the medium term remain clearly on the upside
• possibility of further rises in energy and food prices
• risk that price and wage-setting behavior could add to inflationary pressures
• Second-round effects stemming from the impact of higher energy and food prices on price and wage-setting behaviour must be avoided.
• monetary analysis confirms upside risks to price stability at medium to longer-term horizons
• M3 growth remained very vigorous at 10.3%
• M3 growth overstates the underlying pace of monetary expansion
• the underlying rate of money and credit growth remains strong
• The growth of household borrowing has moderated over recent months, reflecting the impact of higher short-term interest rates and cooling housing markets in several parts of the euro area
• For the time being, there is little evidence that the financial market turbulence seen since early August 2007 has strongly influenced the development of broad money and loans.
• macroeconomic data continue to point to moderate but ongoing real GDP growth
• uncertainty resulting from the turmoil in financial markets remains high
• strongly committed to preventing second-round effects and the materialization of upside risks to price stability over the medium term

Overall, Mr. Trichet had reiterated what the markets already knew, inflation pressures are strong, due to energy and food prices, moderate GDP growth put still (way) above the recessionary level, still a high level of uncertainty surrounding financial market, and strong demand from emerging countries.

What was new from the early statements was the fact that internal demand may be dampening.

In principal the inflation remarks are stronger, ruling out the possibility of a rate cut on the short to medium term, while some decrease in the economic sentiment is expected due to the high level of uncertainty

Looking for an ECB rate cut?

Written by A Forex View From Afar on Wednesday, May 07, 2008

Back to www.thelfb.com

According to WSJ, all 50 analysts asked about tomorrow’s ECB Interest Decision said they are expecting no movement. No surprise here, but afterwards, half of the analyst said they are looking for a rate cut from ECB by the end of Q3, and more then a half said the ECB will cut by the end of 2008.


A Dow Jones Newswires survey of 50 financial institutions found respondents unanimous in anticipating unchanged rates Thursday. Just under half, or 22 of those canvassed, expect the ECB to cut rates by the end of the third quarter, while 34 expect a cut by Christmas.


The thing that does not really add up as easily as it could is the economic logic. If everyone expects US growth to pick up during Q3, why would the Euro-Zone growth not pick in Q3? Would it not just be inline with the global expansion that comes from the US markets coming out of contraction? The analysts had the Euro-Zone cutting rates by the start of the summer, when asked back in December. We are very close to summer, and there is not even a rumor about cutting from officials.

The Analyst thoughts seem to be;

-the US slowdown must drag Europe into a recession, which by the way it has not, and when the US economy starts growing again the Analysts have the Euro-Zone shrinking.

-the analysts are saying that the ECB will change its inflation-fighting view for just one quarter. The analyst logic is the European-slowdown (they are foreseeing) will bring down inflation.

-the same things were said about the US slowdown as well; the Analysts said that it will bring down commodity prices and inflation due to lack of demand from the US. They were wrong, Oil just hit a record at $122 a barrel, food commodities are way up, and inflation is still high in the US.


Economists are wagering that the economic slowdown will do what’s needed to bring down inflation, giving the ECB a way to lower the policy rate without compromising its primary mandate of price stability. But they may be expecting too much, too soon.


It would be a strange call from the ECB to modify its stance so quickly, almost overnight, to one of a single mandate of price stability, to one of growth concerns.


Source:
WSJ: Economists Look for ECB Signal on Rates

Complaining about oil price…

Written by A Forex View From Afar on Tuesday, May 06, 2008

Back to www.thelfb.com

Most US Consumers complain about the higher gas prices that they have to pay, with every fill they do. Gas prices at stations have reached $3.50 per gallon, in some areas.

Gas Prices

Analysts have shown how the different Gas taxation formulas have formed different social patterns. In the US, consumers use the savings from the cheap gas to buy bigger houses, or to move further away from the downtown areas, whilst in Europe the tax money is used to modernize the transport industry, invest in education or reforming health-care (health-care that is now considered by many to be Achilles’ Heel for the US economy).

In Europe the cost per gallon is reaching $10. Furthermore, going to Economics 101, the Gas prices are only as high as they are because someone is willing to pay the price, and cutting taxes (as some political parties suggest) will only fix things in the short them.

Source:
Yahoo: Why Gas in the U.S. Is So Cheap

World Purchasing Manager Index

Written by A Forex View From Afar on Tuesday, May 06, 2008

World Purchasing Manager Index

A new Financial Model

Written by A Forex View From Afar on Friday, May 02, 2008

A new Financial Model
Back to www.thelfb.com

In the last few years a new financial model has been developed. It's called "too big to fail", and it's quite simple- there is nothing too complex here;

1. Generate cash the easy way.
2. Create an off-shore company, with the name 'Bank' or 'Hedge Fund' stuffed somewhere in the title (the more complex the better).
3. Issue some bonds, not too many, just a couple of thousand million. The triple A rating won't be hard to find at the local rating agency, they are six months behind the curve. Try to provide a better return than the market; a 10% offer will certainly do the trick. If possible try to pick bonds with a one time payment at maturity, you'll see why later
4. At the same time develop a very aggressive marketing campaign. Investors have to hear about you and someone has to buy those bonds you're issuing. make it really flashy.
5. Make sure you have an outrageous salary, and probably some off-shore accounts too.
6. By this point you have got yourself a couple of million Dollars, which you are going to invest in some more aggressive campaigns. But do not worry about the bond prices/value at this point in time
7. Doing this a couple of times (bonds issue + aggressive marketing) you get yourself assurance that you can pay the coupons at maturity, and by having new bonds (inflows coming in your books) you can assure to pay the older bonds at maturity.
8. Get a good lawyer and book-keeper, because you will need them both.
9. Use them both to dodge accounts and states law, and probably regulators too.
10. Here comes the interesting part, after doing this for couple of years and the investors trust you, have a big bond issue. We are talking in billions here.
11. Use that money to invest in shares/bonds/credits/everything owned by other financial institutions, but do NOT invest in your own flashy-named company.
12. Continue to buy into other companies, really get the paper trail as long as you can.
13. Some eyebrows should be raised at this point by investors and regulators. No need to worry though; that good lawyer coupled with your outrageous salary in off-shore accounts will probably save you from a death sentence.
14. At this point in time, you are “too big to fail”. In case something wrong happens speak with your Trade Desk department to sell some Call Options (to make money on the way down as your share price crashes). After the Fed jumps in, because they will want to save you from failing, make sure you mark those options.
15. At the end, the offshore accounts will still be yours, plus there are some possibilities to have a share in the new company that comes from the Fed saving your company from collapse.

See how financial innovations make the markets go around? This is a classic case, with the marketing parts inspired from Enron, and the “too big to fail” taken from Bear Sterns. 15 easy steps to follow.

The saddest part of it all is that it happened, is happening, and will continue to happen. Happy Days are here again!

An Overview of the latest news

Written by A Forex View From Afar on Thursday, May 01, 2008

Back to www.thelfb.com

Wednesday's calendar made it one of the busiest days in recent times. Highlighting the important parts; we had the Bank of Japan Interest Rate decision, the ADP numbers, Cad and US GDP, and the FOMC decision. We won’t see a day like this again too soon.

If the Interest Rates decisions are well known, hold for BoJ at 0.50% and cut to 2.00% for The Fed, The US GDP and the ADP numbers will be discussed in just a few lines, as for some of today’s releases.

The GDP number came in at 0.6% annualized, being translated in a 0.15 to 0.20% quarter gain. A lot of analyst said there were two major factors making the GDP look better then it actually was. The first was the deflator number, the number subtracted from the GDP due to inflation. The deflator was calculated by BEA at 2.6%. Many analysts said it should have been bigger (same things were heard when 2007 Q4 appeared). The other factor influencing the GDP was the inventories numbers, which increased the number by 0.8%, pushing the GDP above the 0% rate. The GDP was a nice figure from by the US economy, one that many didn’t expect.

The ADP number came 10k, which is pretty good compared to what the markets had expected, -60k. Taking a close look at the ADP numbers, a lot of jobs were created by the small companies, 42k, being the only ones to add workers to the payroll, but these companies are excluded by the NFP.

Furthermore, the goods-production industry had a loss of 54k jobs, compared with a 64k gain in the Service side of the economy. This somehow, defies the recent trends; the cheap dollar helping exporters, but what is to export when the good-production companies are deleting jobs at this pace, making it the seventeenth consecutive monthly decline? Of course, I’m a little pessimistic about the 64k added jobs in service side of the economy too. They appear a little too many, from were we are standing right now.

The weak dollar gets things going with the ISM Non-Manufacturing report, with 71%(!!!) of respondents reporting higher prices, making the trend now at 16 months. Except Methanol, all commodities are reported higher. The ISM shows the Export part of the economy is doing quite well, expanding for the last 65 months. Impressive, isn’t it?

Here are some of the respondent’s opinions:


• "The decline in the value of the dollar is dramatically affecting our material prices because we purchase over half of our material requirements from overseas." (Transportation Equipment)
• "Higher energy rates, unfavorable exchange rates, high levels of inflation in Asia and a drop in demand are challenging our business and supply chain." (Nonmetallic Mineral Products)
• "Continued bio-fuel/spec investor driven inflation of commodities is stifling!" (Food, Beverage & Tobacco Products)
• "Still strong in spite of general business slowdown." (Primary Metals)
• "Oil, oil, oil, energy, energy, energy, metals, metals, metals." (Fabricated Metal Products)

TheLFB Team & The View From Afar Blog

© 2008 A Forex View From a far Trading Blog

Trade Desk View

Fundies and Trading
There is a constant question from some traders as to why anybody would ever need to consider the ‘F’ word when trading. Fundamentals: what is so damaging at looking at both Technical charts and having a Fundamental filter to gauge how many Lots to put on? Why is it that accepting that Technicals give us price points to trade, but Fundamentals determine the direction that we travel is so difficult for some traders to accept? Without a Fundamental Filter very few pure Technical traders would have seen this Dollar move coming today.

Want to subscribe?


Subscribe in a reader.